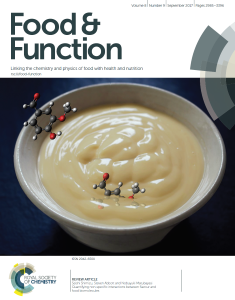
Food-Flavour Interactions

This app accompanies the paper Seishi Shimizu, Steven Abbott and Nobuyuki Matubayasi, Quantifying non-specific interactions between flavour and food biomolecules, Food and Function, Food & Function, 2017, 8, 2999 - 3009, DOI 10.1039/C7FO00313G , which became the cover image for this issue.
For those who come to it directly, an exploration of some of the earlier KB apps on this site might be helpful!
KB-Flavours Gelation/Denaturation
For this first method, the Inputs are the curve of gel or denaturation transition temperature versus concentration of the flavour molecule plus ΔHP which is the enthalpy of gelation or denaturation of the protein at temperature T when no flavour molecule is present.
The Output is the change in the key KB Integral, GPF that describes the relative strength or weakness of the interactions (compared to the bulk average) between protein (P) and flavour molecule (F). It is given by the following where the derivative is taken from the polynomial fitted curve:
ΔGPF = (ΔHP/RT²)(δT/δcF)
Now the technique using vapour partition coefficients via headspace analysis:
KB-Flavours VP
The Inputs are the vapour/liquid partition coefficient, K at protein concentration cP. Note that the app uses this definition of K (so it is important to get it right!) which is the one adopted generally in the literature and, for mathematical convenience, the paper uses the inverse definition, liquid/vapour. The data are plotted in terms of ln(K) as that is used to obtain the KB Integral. The estimated molar volume of the flavour molecule (use the MWt if no other information is available) can be included in the dataset. The MVol can also be adjusted to see the effect on the calculated KB Integral.
The Output is the key KB Integral, GPF that describes the relative strength or weakness of the interactions (compared to the bulk average) between protein (P) and flavour molecule (F). Note that the units are l/mol not the usual cc/mol - these are very large KBI!:
Now the technique which takes the n (number of molecules) and K (binding constant) from fitting of osmometry or vapour pressure data to the classical (but demonstrably erroneous) specific binding models. Representitive values of n and K taken from the literature (which frequently contains contradictory values) are shown:
KB-Flavours from n & K
| Protein | Flavour | n | K |
|---|---|---|---|
| β-LG | Benzaldehyde | 0.5 | 600 |
| β-LG | 2-Nonanone | 0.5 | 1800 |
| β-LG | Methyl Benzoate | 0.9 | 280 |
| β-LG | Ethyl Hexanoate | 0.9 | 1000 |
| β-LG | i-Amyl Acetate | 0.08 | 7500 |
| β-LG | β-Ionone | 0.9 | 11700 |
| β-LG | γ-Undecalactone | 1 | 5900 |
| BSA | 2-Heptanone | 4.5 | 270 |
| BSA | 2-Nonanone | 4.5 | 1800 |
| Soy | 2-Heptanone | 4 | 110 |
| Soy | 2-Nonanone | 4 | 930 |
It is surprising that although the classic binding analyses (from osmometry, vapour pressure etc.) giving n (number of bound molecules) and K (binding constant) are flawed, we can take those numbers and calculate the difference of two KBI. Therefore old data can be "recycled" into a thermodynamically correct analysis of what is going on:
nK/(1+Kcf) = GPF - GPW
Because we are interested in GPF we need an estimate for GPW. This can be taken from the molar volume which, in turn, can be estimated from the MWt. For globular proteins, the method of Chalikian can be used.
The Output is the key KB Integral, GPF that describes the relative strength or weakness of the interactions (compared to the bulk average) between protein (P) and flavour molecule (F). Note that the units are l/mol not the usual cc/mol - these are very large KBI!
There has been much confusion as to the true mechanism of what happens when flavour molecules interact with proteins simply to bind harmlessly or to stabilise or destabilise the protein itself or the gel it has produced.
This app takes real experimental data and, via KB, shows what interactions are actually taking place. There are three general techniques used for studying flavour effects.
- The measurement of temperature of gelation or denaturation as a function of flavour concentration.
- The measurement of vapour/liquid partition ratio, K, as a function of protein concentration.
- The measurement of the relative concentration of flavour across a semi-permeable membrane and its dependency on the concentration inside the membrane.
It turns out that complexities (molalities versus molarities) of the third method make it difficult to extract KB values from the pure experimental data. Instead, a general method is able to calculate the KBI via the n and K values derived from the classic (but flawed) specific binding model. This allows us to painlessly re-analyse data from osmometry and, as it happens, vapour pressure experiments.
 The Javascript code is Copyright © 2017 Prof Steven Abbott and is distributed under the Creative Commons BY Attribution license. Users are encouraged to examine the code themselves. All key aspects of the calculation are flagged up with comments.


